Water Quality Management of Seunggi-cheon in Incheon, Korea
/ 4 min read
Table of Contents
The following article was also featured on Mason Korea and the Center for Security Policy Studies.
Introduction
Throughout the Fall 2024 semester, Student Fellows at the Center for Security Policy Studies Korea (CSPS-Korea) conducted a unique research project under George Mason University’s Mason Impact Mini Grant titled “Enhancing Water Quality Management of Seunggi-cheon in Incheon, South Korea: A Region-focused, Low-cost, Nature-based Approach.”
As a Student Fellow at CSPS-Korea, I alongside our team performed a mixed-methods approach to quantitatively assess the water quality of Seunggi-cheon, one of Incheon Metropolitan City’s streams, to better understand its current environmental conditions, and provide actionable policy suggestions.
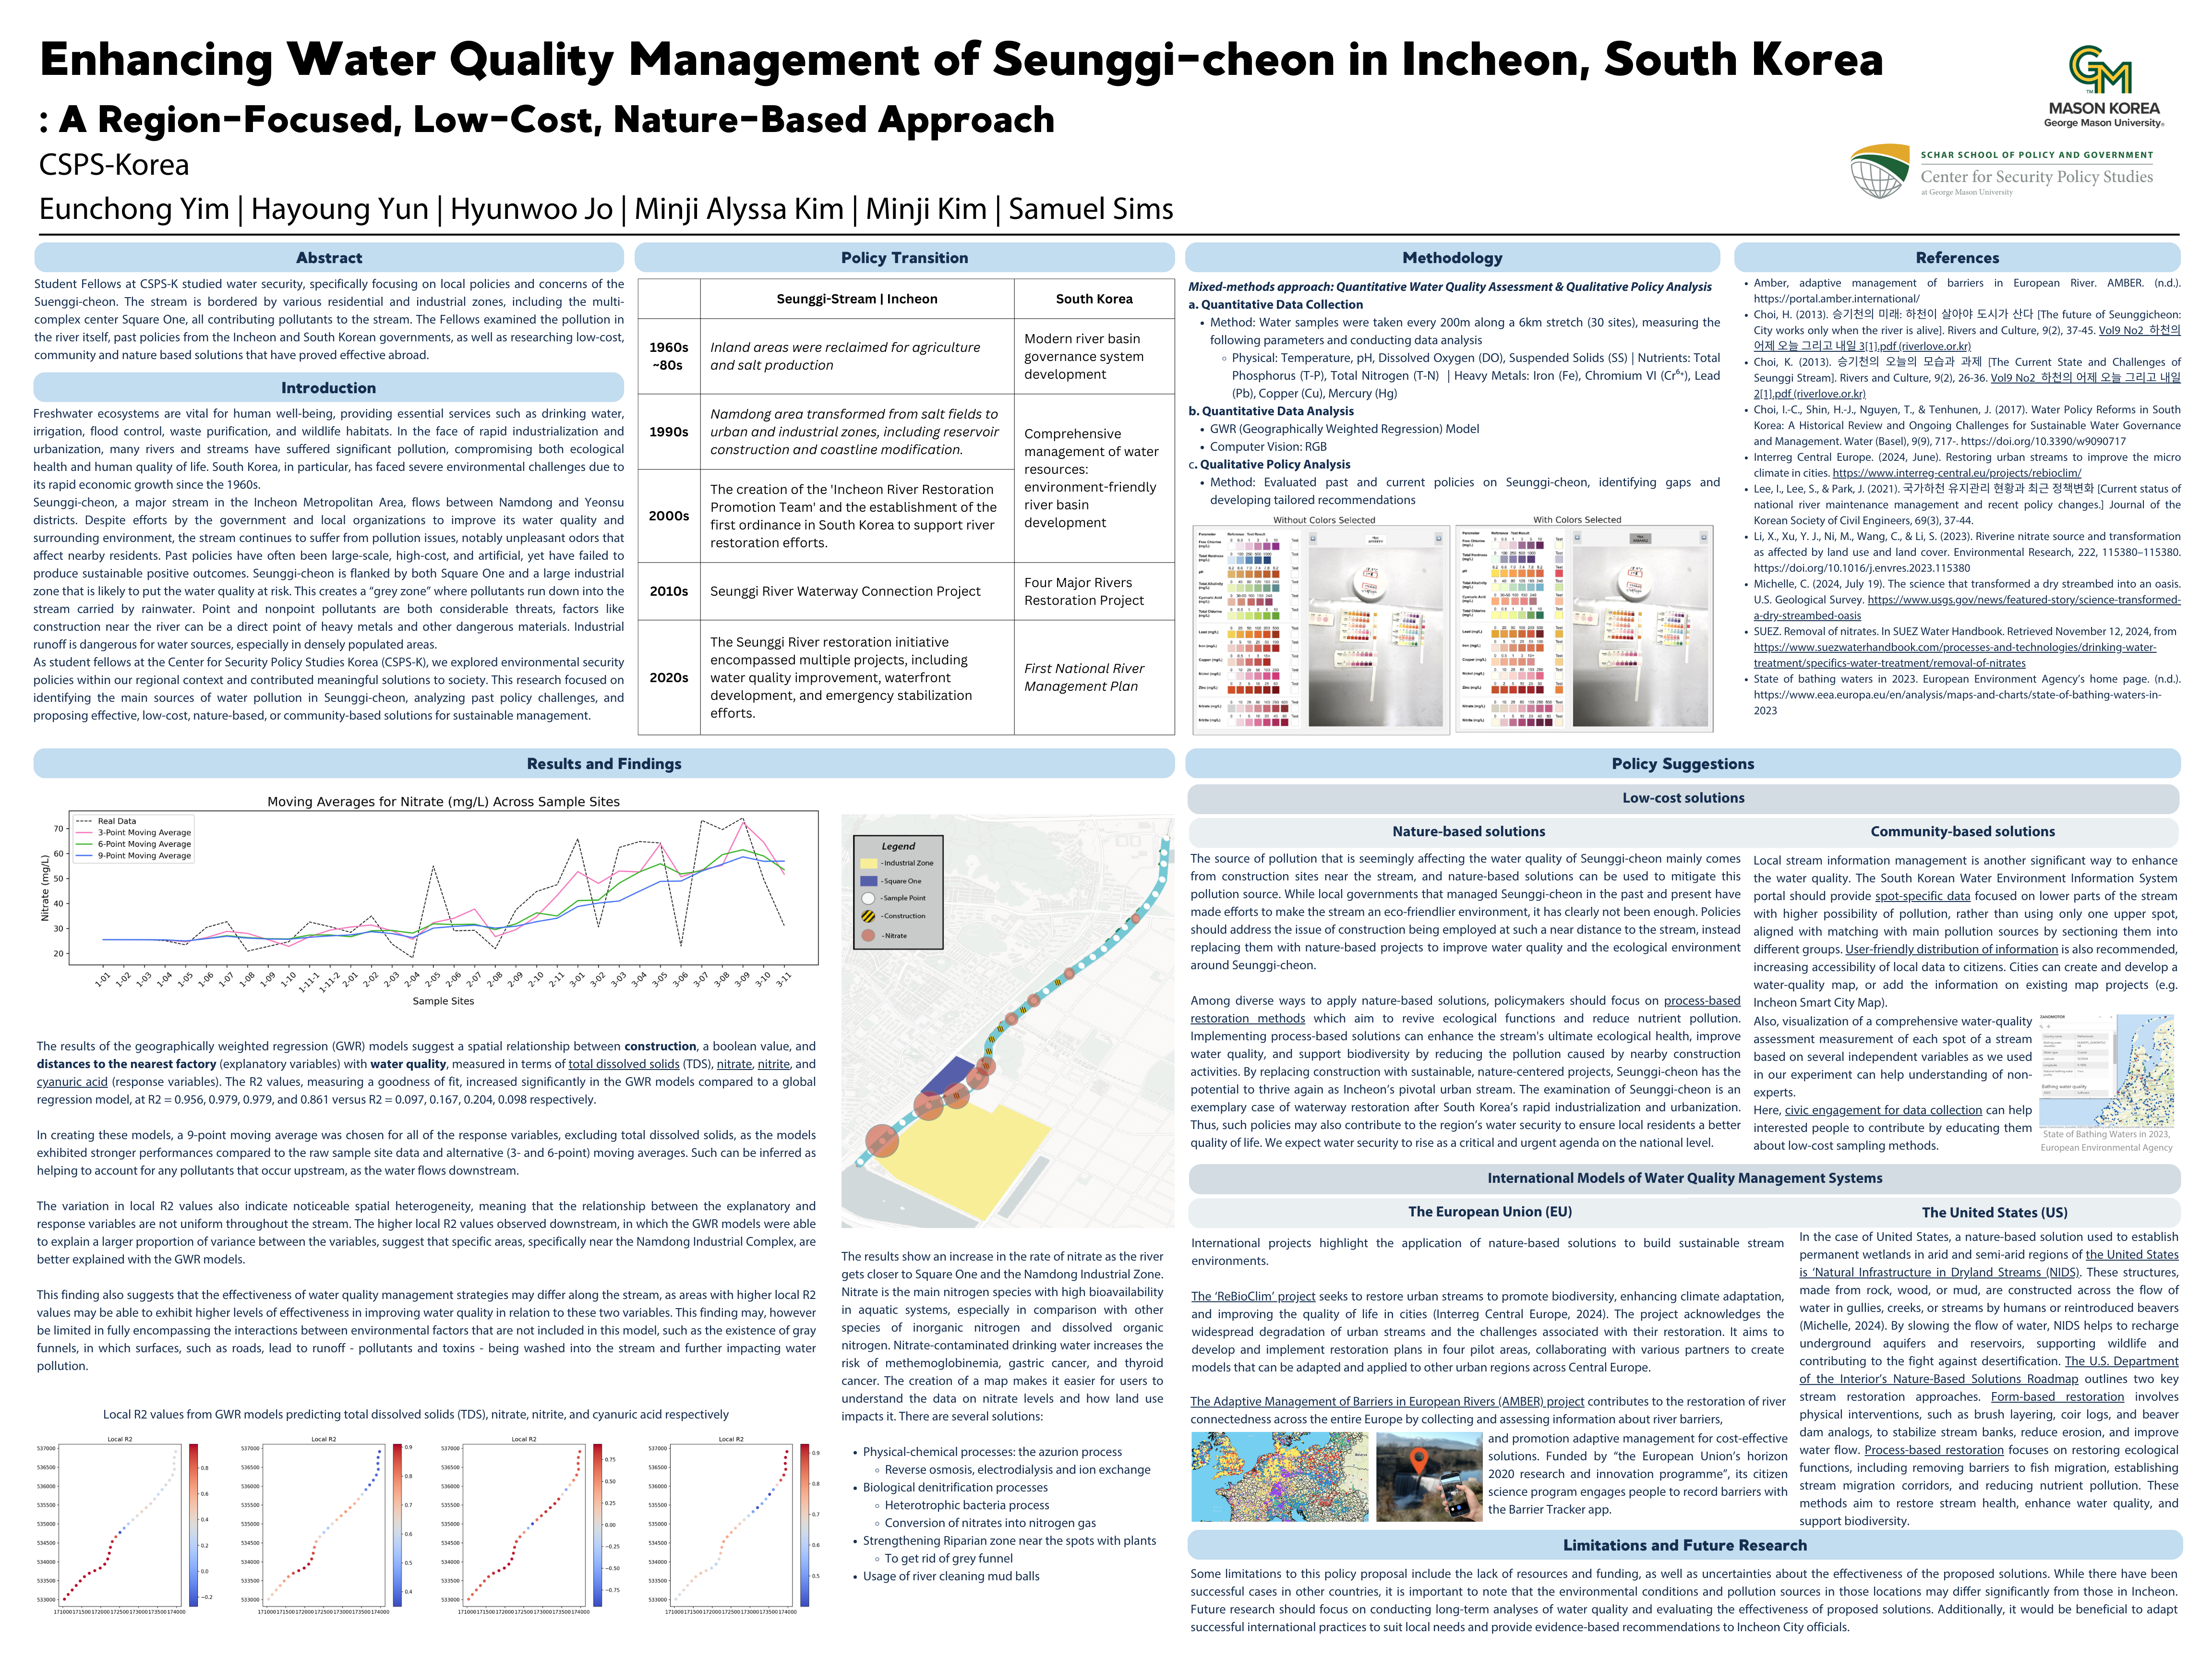
With an emphasis on water security, we researched the possible threats posed by various pollutants near the stream, such as those carried by rainwater or due to construction, recognizing the importance and potential danger of heavy metals and industrial pollutants in a densely populated area such as Incheon with various residential and industrial zones.
Based on the past challenges of past policies to improve the stream’s water pollution and quality, our Fellows came with the aim to propose effective, low-cost, nature-based, or community-based solutions for sustainable management. In doing so, we conducted a thorough literature review on past policies and took water samples throughout the stream, quantitatively analyzing the data with the assistance of computer vision and through geographically weighted regressions (GWR).
Geographically Weighted Regression
Geographically Weighted Regression (GWR) is a spatial regression technique to model the relationships between non-stationary variables - that is, variables whose relationships vary over space. To do so, it performs a local least squares regression in different “search windows” for each point, allowing for it to account for locality.
Having been tasked with the data analysis part of our research, this was my first time learning and using GWR - and I thank Dr. Dakota McCarty for their help in getting this completed!
- Python Code
   import numpy as np    import libpysal as ps    from mgwr.gwr import GWR, MGWR    from mgwr.sel_bw import Sel_BW    from mgwr.utils import shift_colormap, truncate_colormap    import geopandas as gp    import matplotlib.pyplot as plt    import matplotlib as mpl    import pandas as pd
    # Load experiment dataset and sample sites    stream_data = pd.read_csv('ExperimentData.csv')    stream_shp = gp.read_file('seunggi_stream_sample_sites.gpkg')    buildings = gp.read_file('buildings_2km.gpkg')
    # Use same site names for stream_shp    stream_shp['site'] = stream_data['site']
    # Merge stream_data and stream_shp into gdf using site name    gdf = stream_shp.merge(stream_data, how='left', on='site')    gdf.columns = gdf.columns.str.strip()
    # Create new column based on construction conducted near a site    construction = gdf['site'].isin([    'site-02-02', 'site-02-05', 'site-02-07',    'site-02-08', 'site-02-09', 'site-03-03'])    gdf['Construction'] = construction.astype(int)    gdf.head()
    factories = buildings[buildings['A9']== '공장']
    gdf = gp.sjoin_nearest(gdf, factories, distance_col="distances", lsuffix="left", rsuffix="right", exclusive=True)
    def gwr_model(X, y):      # Prepare stream dataset inputs      g_y = gdf[y].values.reshape((-1,1))      g_X = gdf[X].values      u = gdf['geometry'].x      v = gdf['geometry'].y      g_coords = list(zip(u,v))      g_X = (g_X - g_X.mean(axis=0)) / g_X.std(axis=0)      g_y = g_y.reshape((-1,1))      g_y = (g_y - g_y.mean(axis=0)) / g_y.std(axis=0)
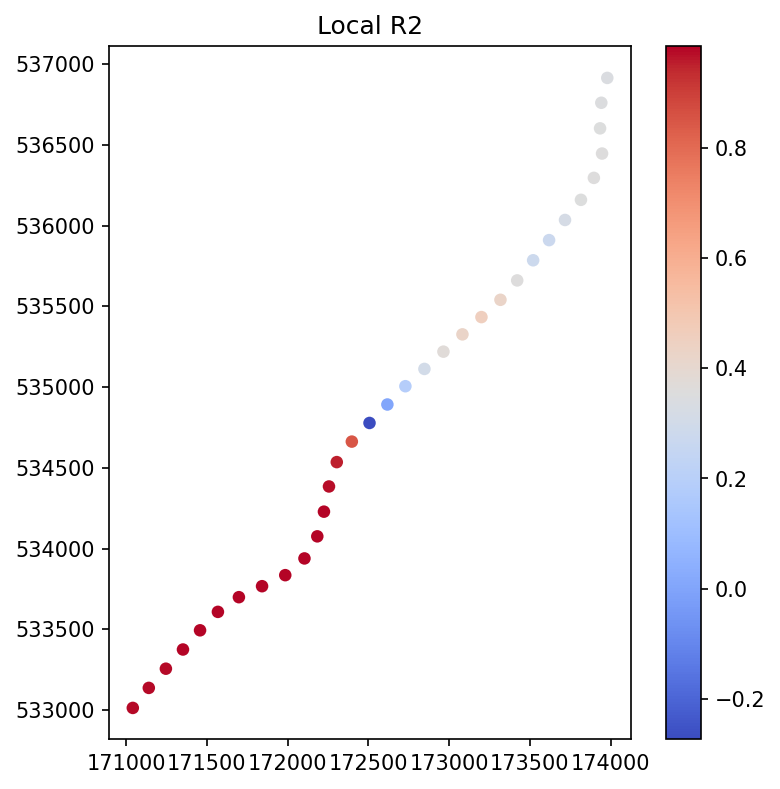
      # Calibrate GWR model      gwr_selector = Sel_BW(g_coords, g_y, g_X)      gwr_bw = gwr_selector.search(bw_min=2)      gwr_results = GWR(g_coords, g_y, g_X, gwr_bw).fit()      gwr_results.summary()      gdf['gwr_R2'] = gwr_results.localR2      fig, ax = plt.subplots(figsize=(6, 6))      gdf.plot(column='gwr_R2', cmap='coolwarm', linewidth=0.01, k=5, legend      ax.set_title('Local R2', fontsize=12)      plt.show()
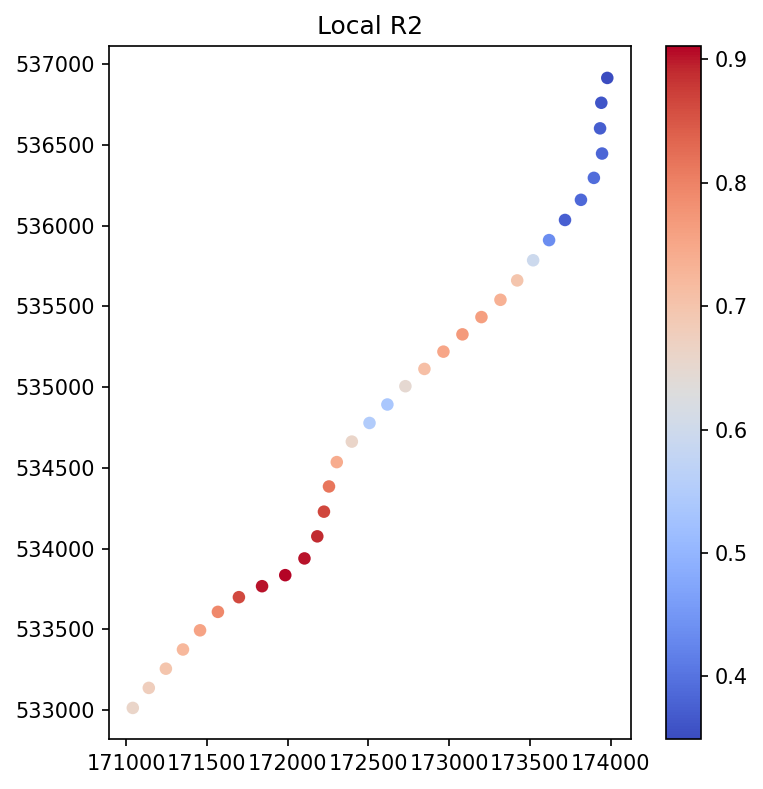
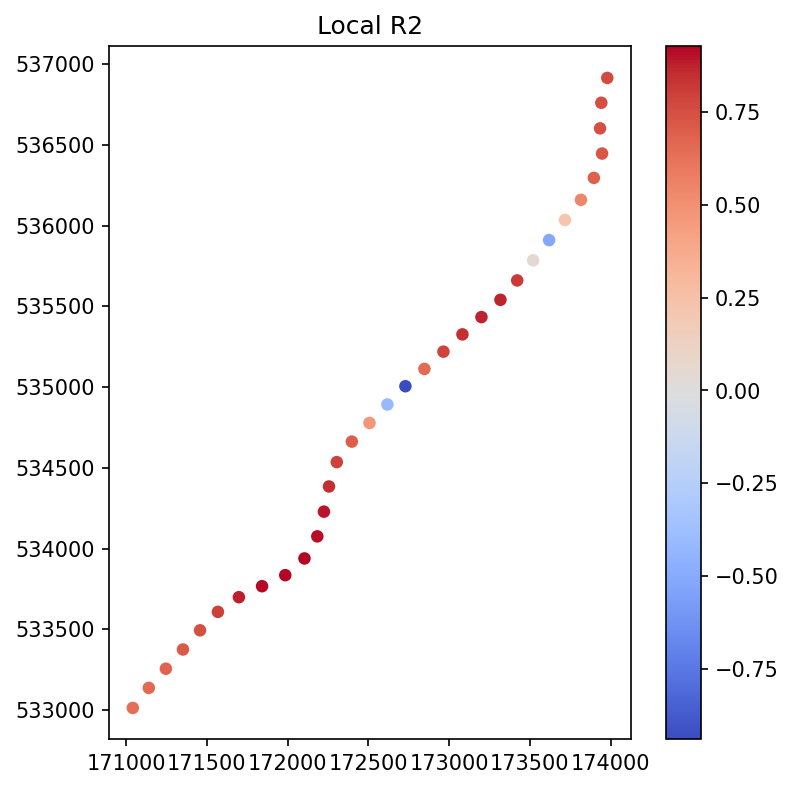
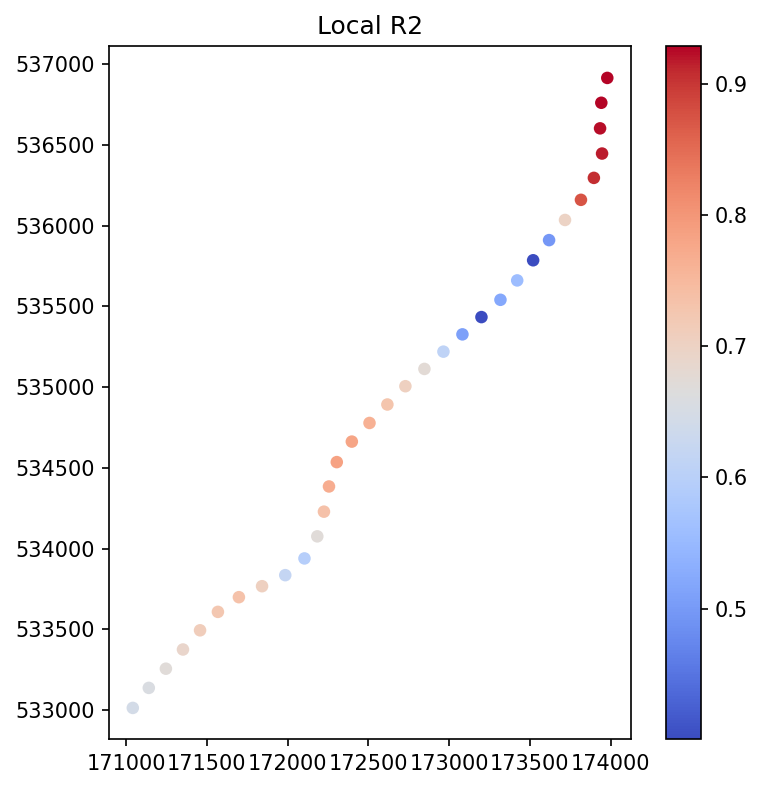
Local R2
The explanatory variables in this research are construction (whether construction was happening nearby a site) and distance to the nearest factory (from GIS건물통합정보 data by the Ministry of Land, Infrastructure and Transport).
Total Dissolved Solids (TDS)
Nitrate 9pt Moving Average
Nitrite 9pt Moving Average
Cyanuric Acid 9pt Moving Average
Conclusion
Based on our analysis, we found that the effectiveness of water quality management strategies may differ along the stream, emphasizing the importance of locality and the interactions of various environmental factors that impact the stream’s water quality. We suggested nature-based, community-based solutions, based on those within the European Union and United States, as a cost-effective approach that could be utilized and applied in Seunggi-cheon to improve water security in the region.
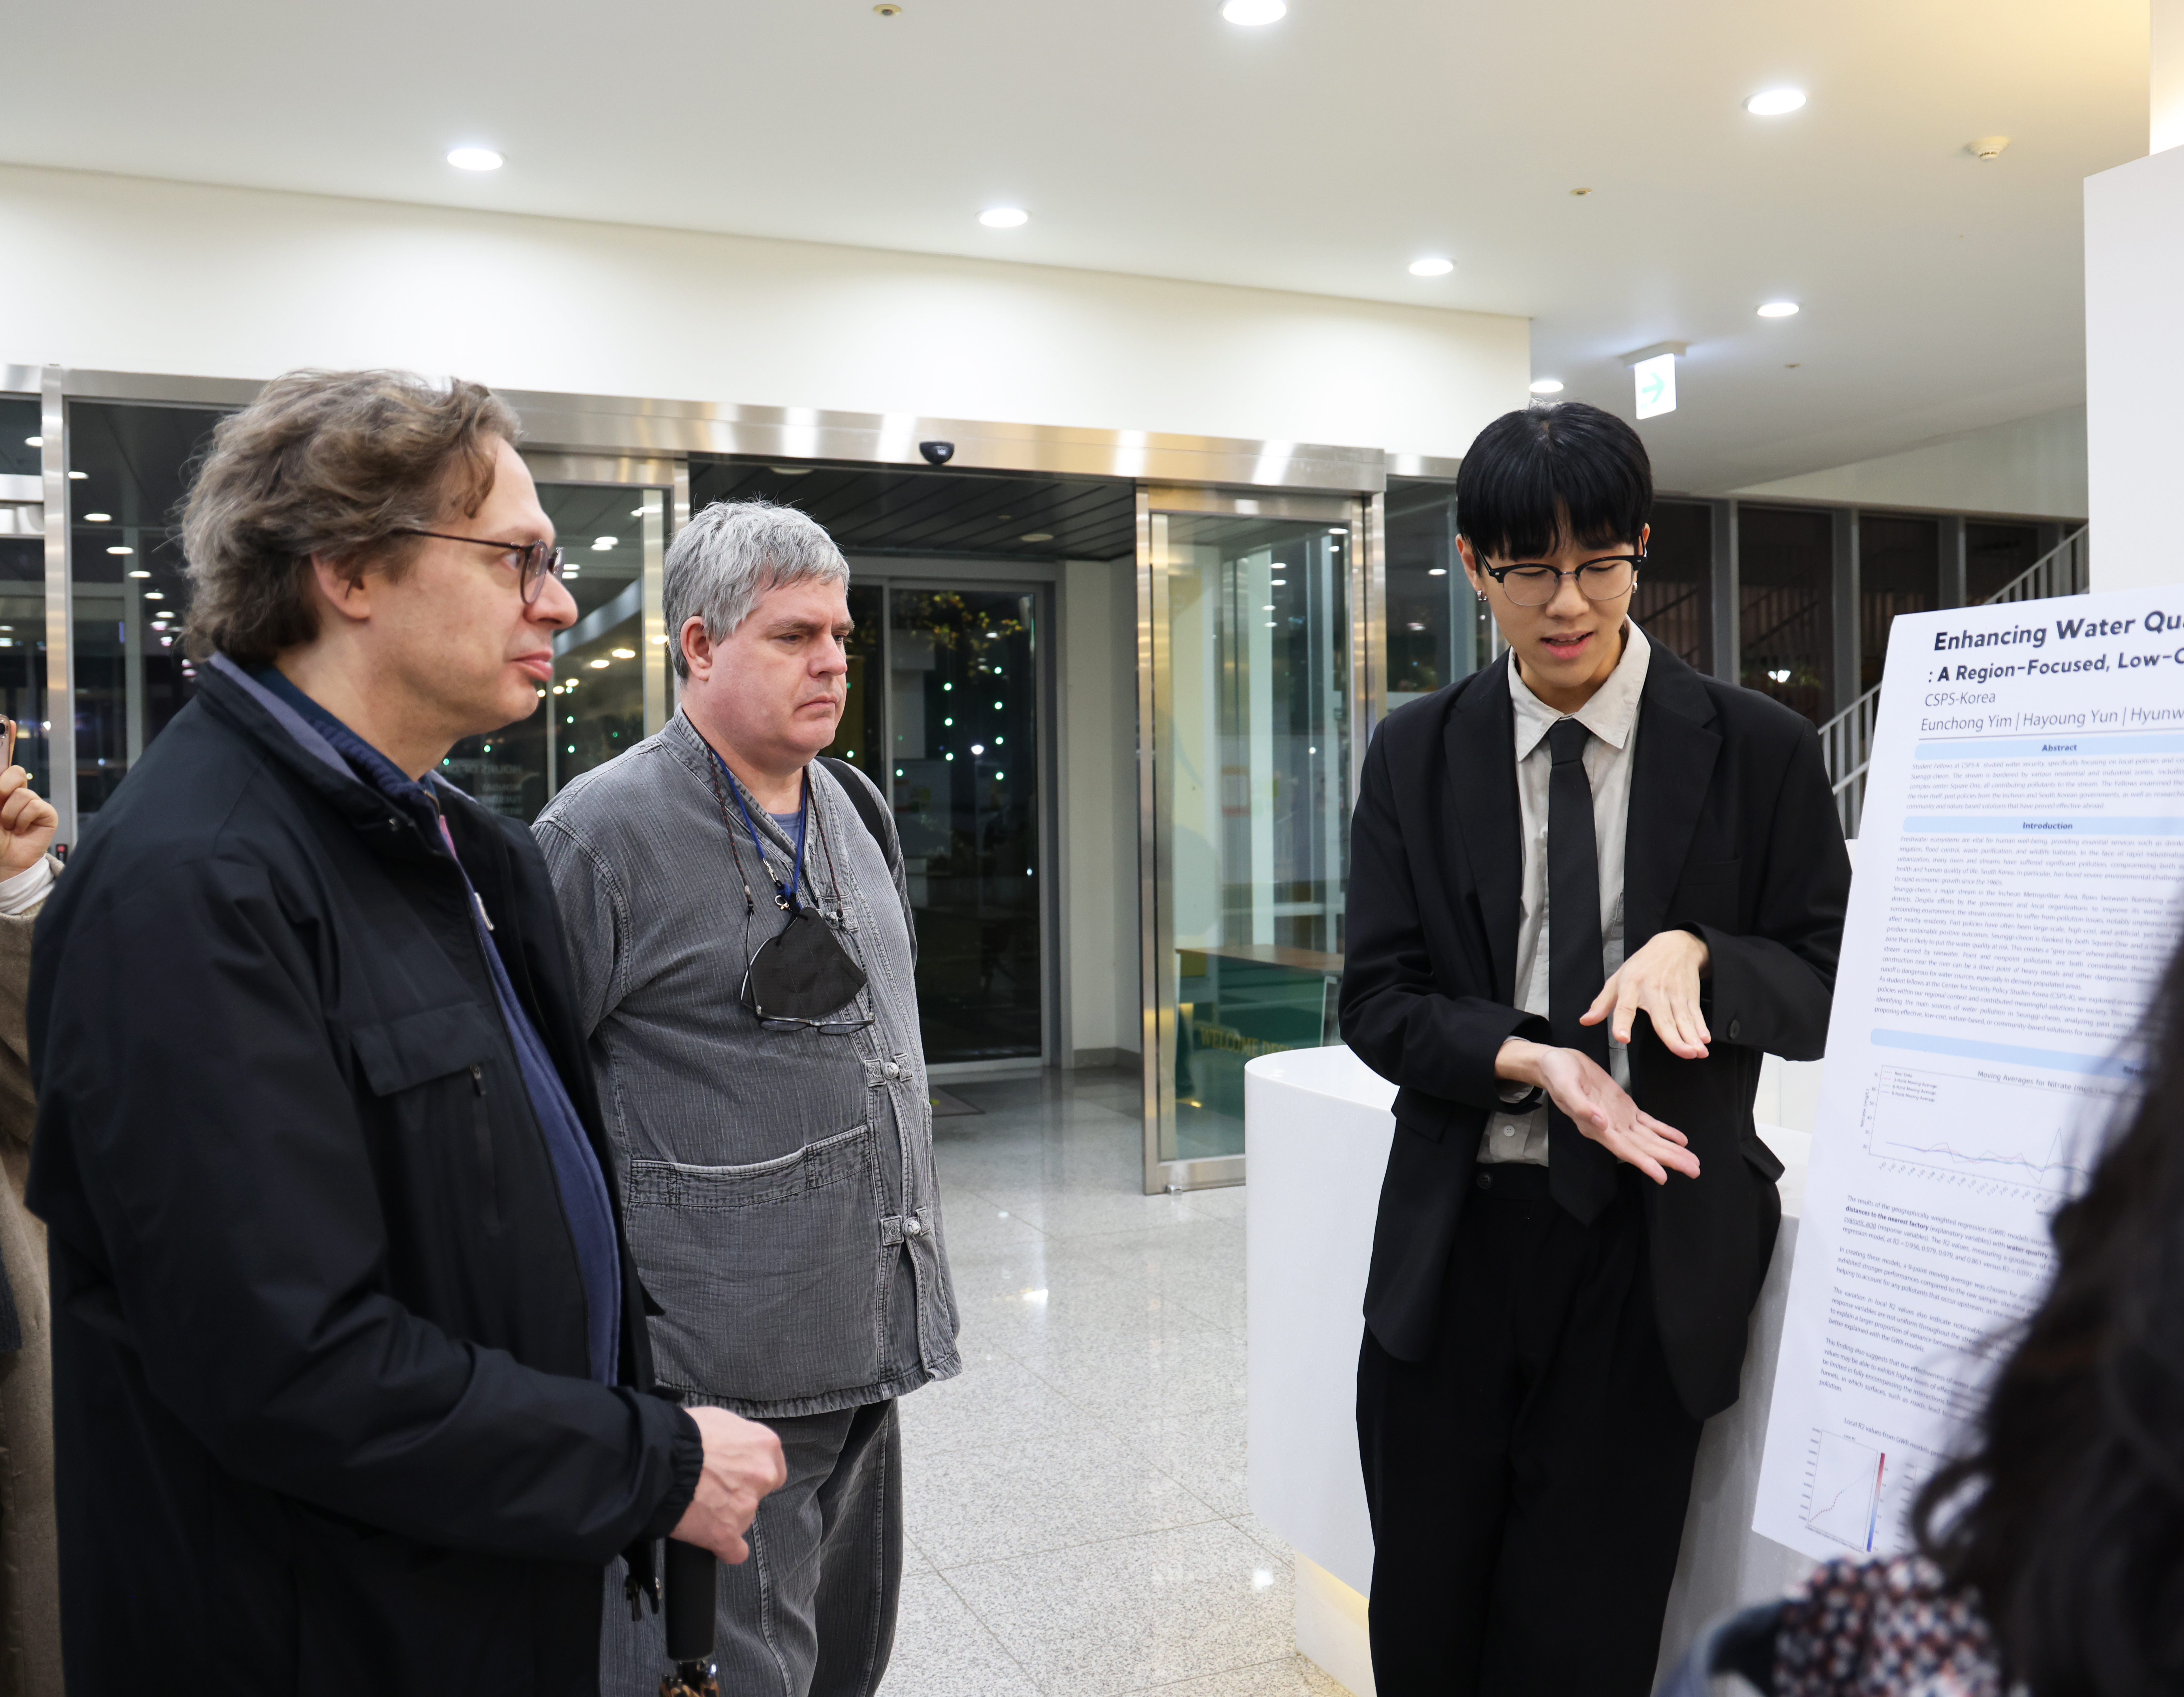
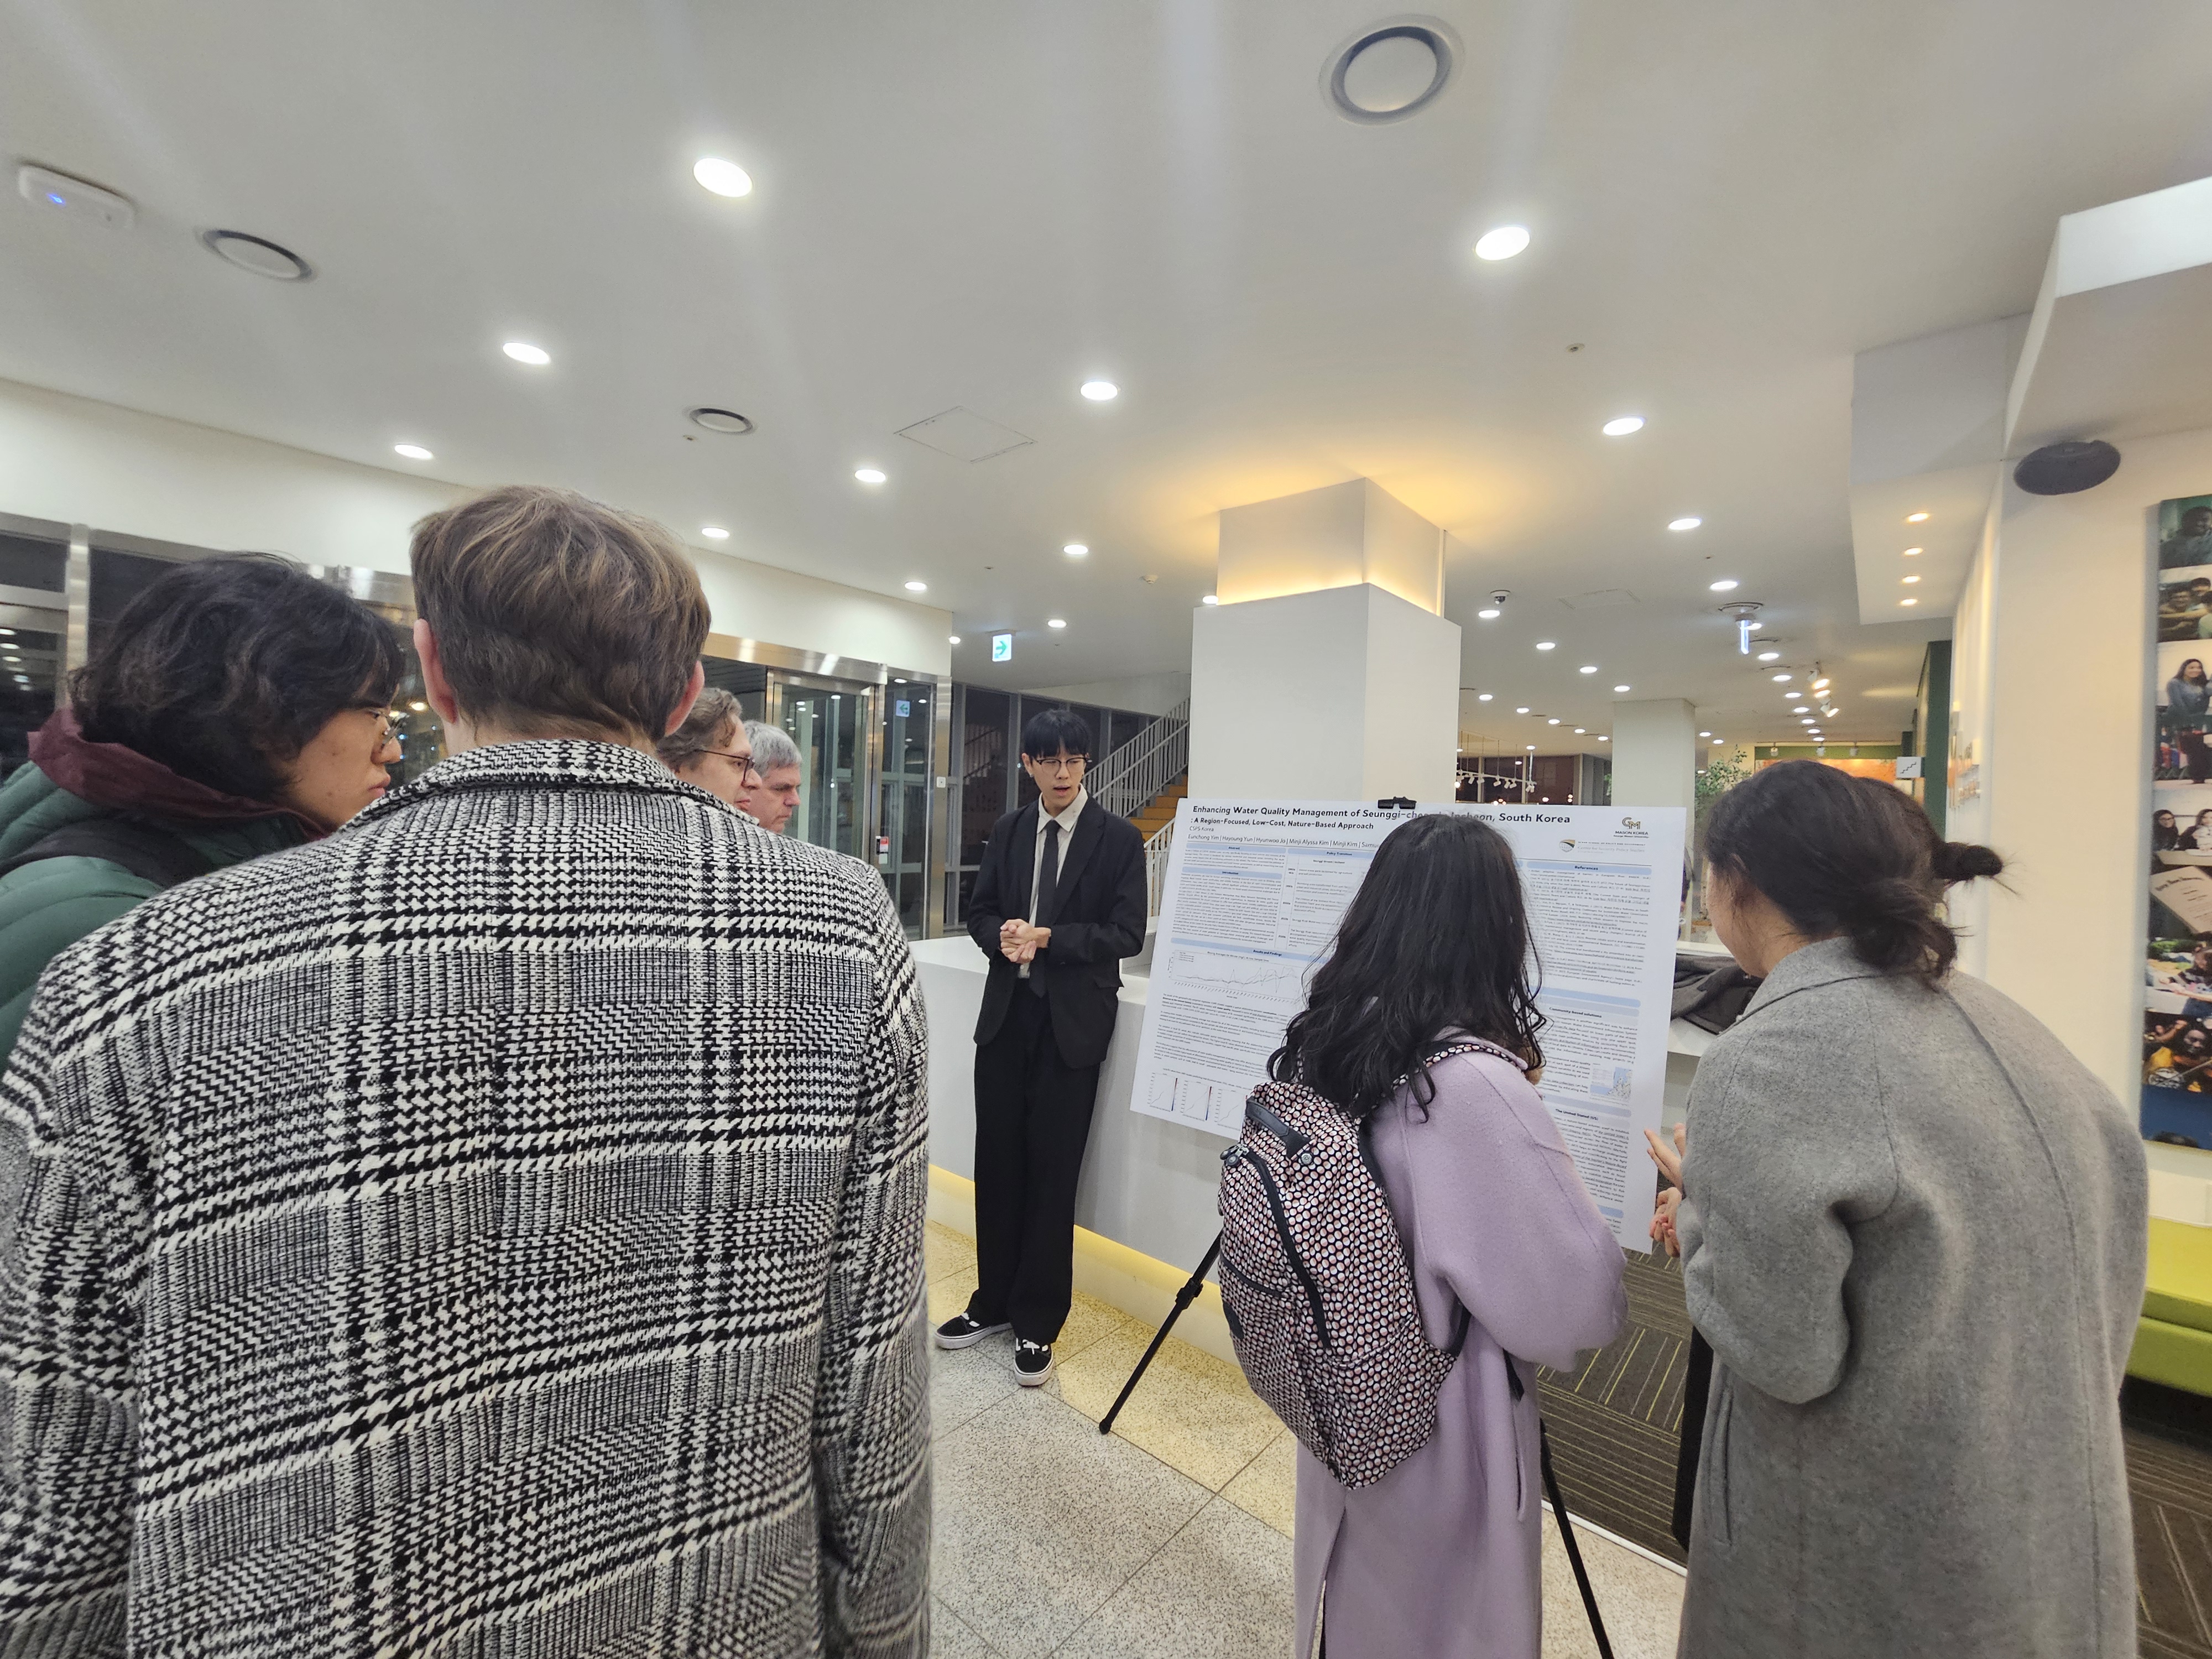
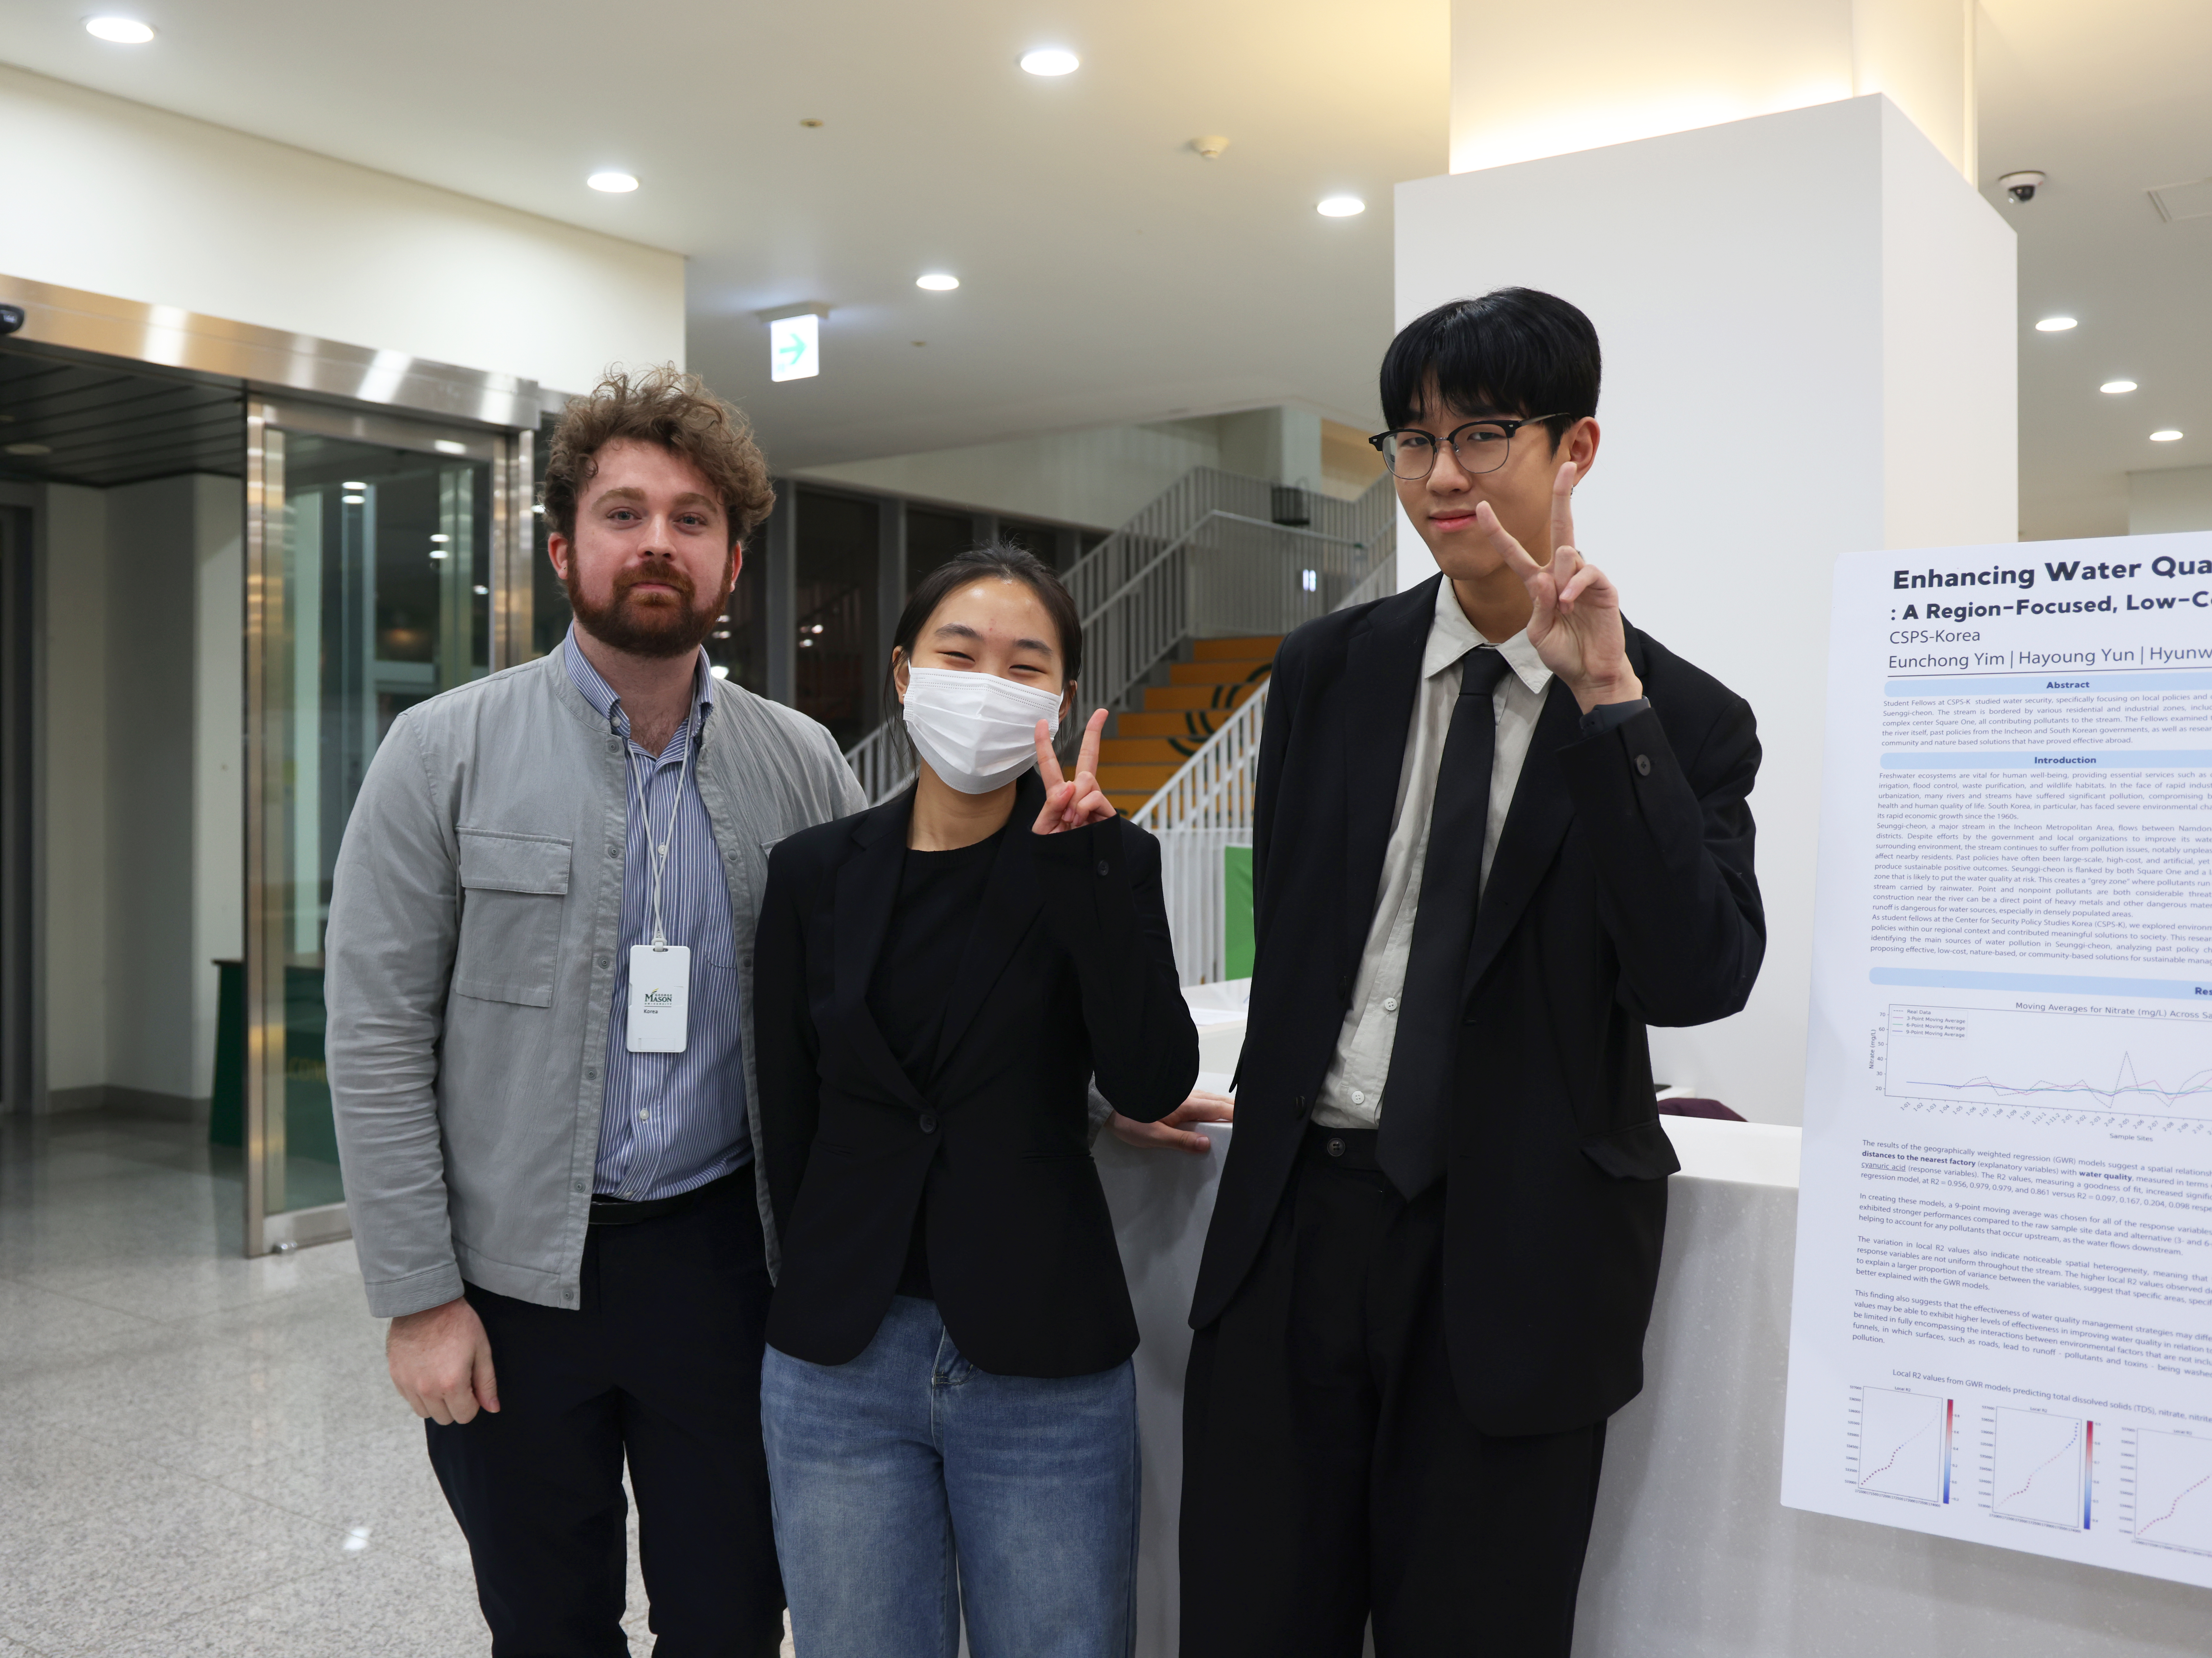
Our research was presented in the Fall 2024 Mason Korea Student Project Showcase on November 26, 2024 for the Mason Korea community to see, bringing in valuable community and academic insight into our project. Furthermore, we aim to publish our research in an academic journal to not only address the needs of the Incheon Metropolitan City but also provide much-needed discourse in the areas of water security and environmental research.
20241128_Fall 2024 Mason Korea Student Project Showcase Certificate.pdf